Organization Analytics
Roll cost, requests, and tokens up across every project in your organization, broken down by model, project, or API key
Organization Analytics rolls usage up across every project in your organization into one view. Where the project Analytics page answers "where does this project's spend go?", this page answers it for the whole org — and lets you pivot the breakdown by model, project, or API key.
Organization Analytics is an Enterprise feature, available to organization owners and admins. On lower plans the page shows an upgrade prompt instead, and Enterprise-only items are flagged in the sidebar.
Open it from the Analytics item under Organization in the sidebar. Like the rest of the dashboard, it respects the shared date-range picker, so every chart and stat reflects the same window.
Summary
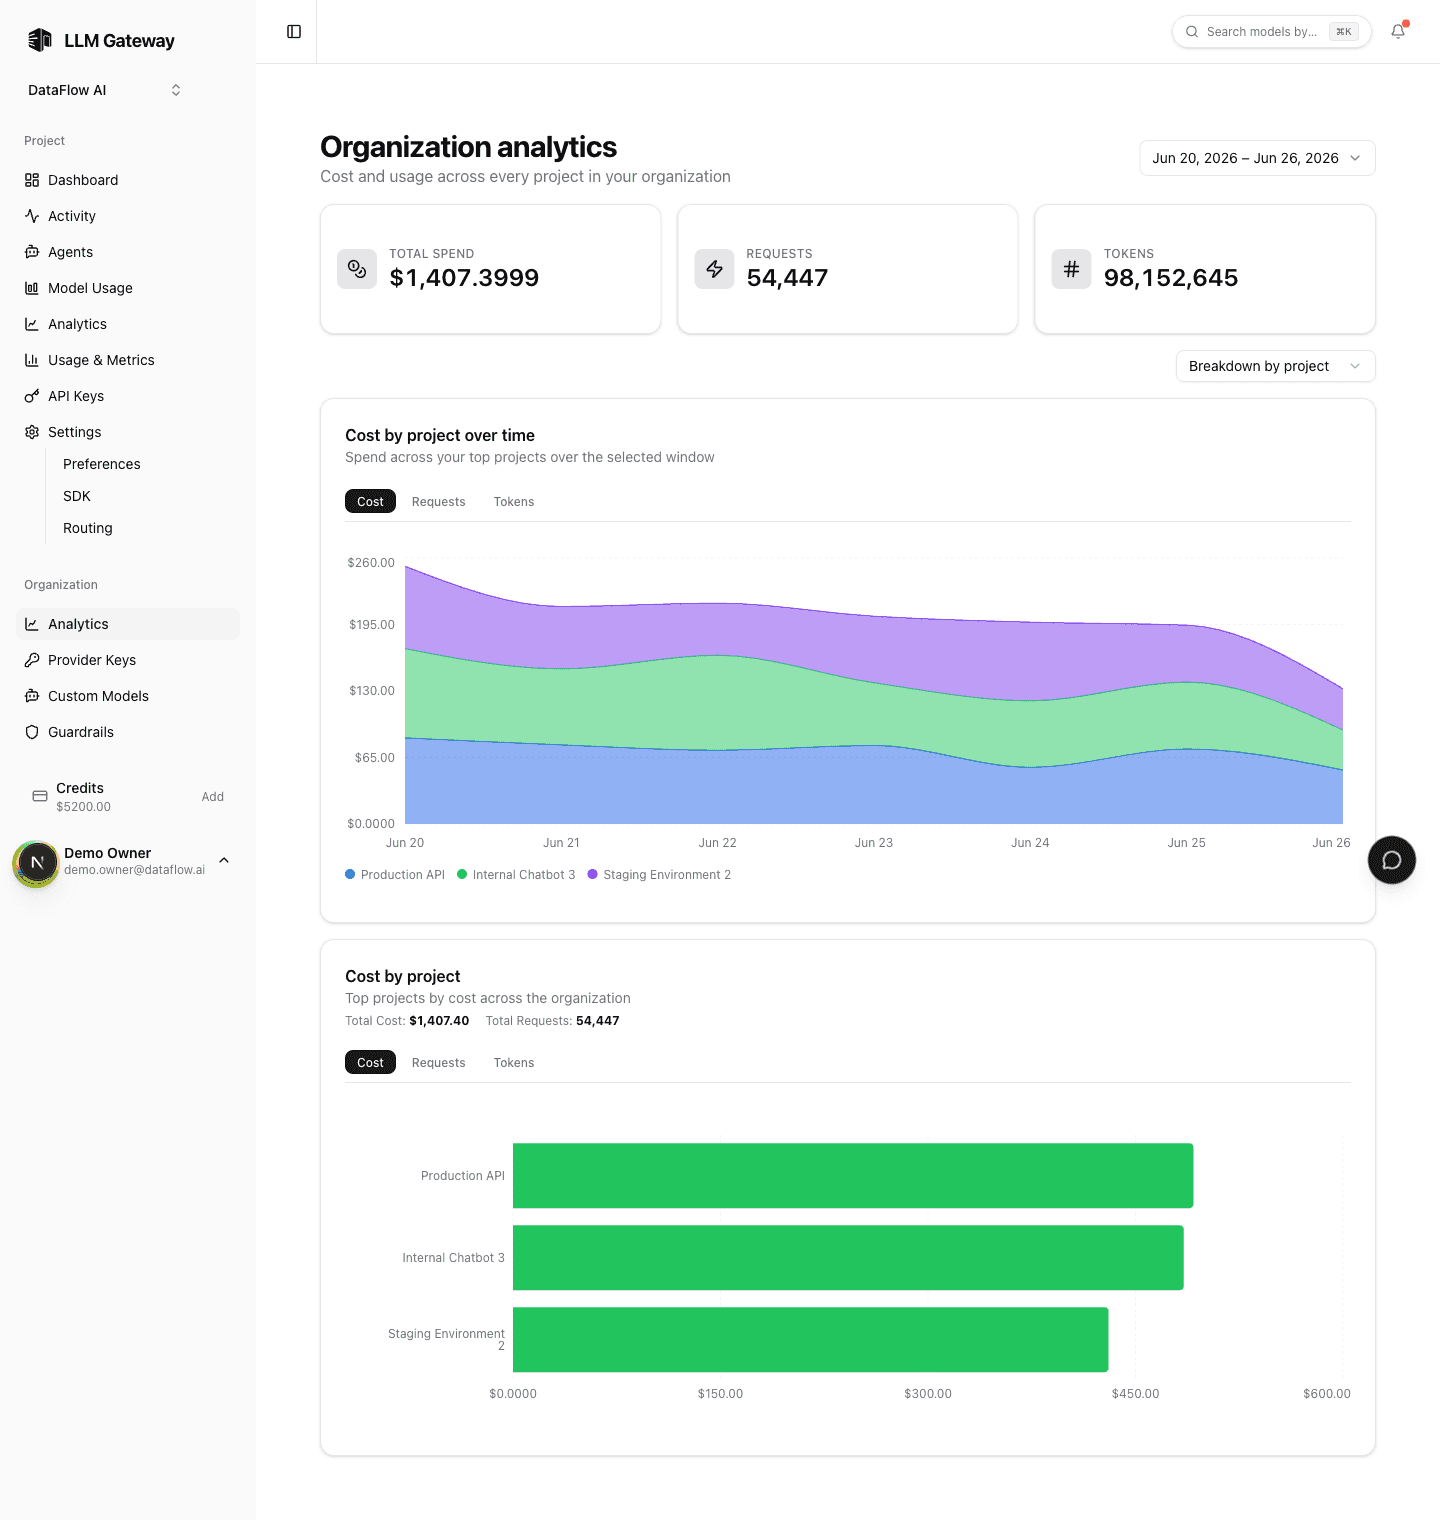
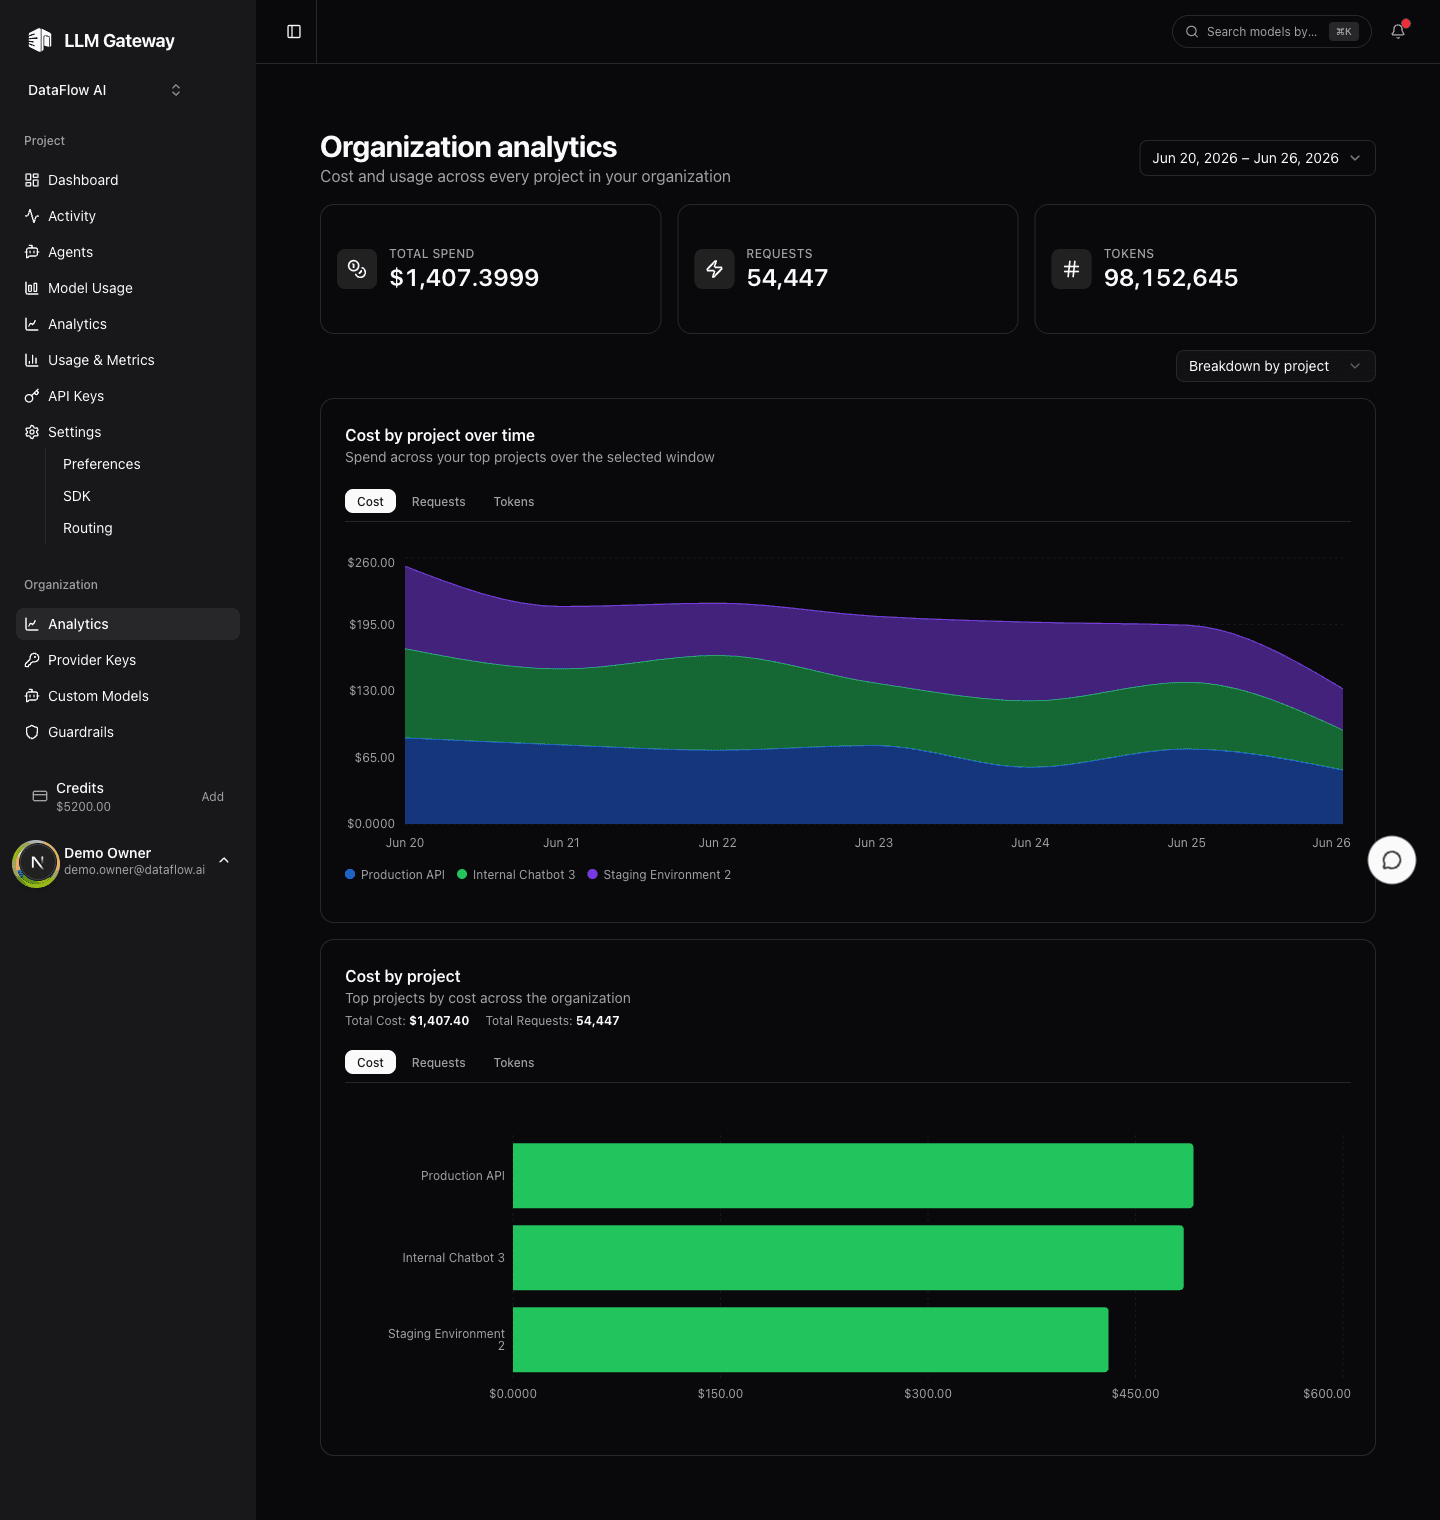
Three cards at the top total the selected range across the whole organization:
| Card | What it totals |
|---|---|
| Total spend | Combined cost of every project, in USD |
| Requests | Total requests routed across the org |
| Tokens | Total tokens (input + output) |
Breakdown
A single group-by control switches what the two charts below break the usage down by:
| Group by | What each series represents |
|---|---|
| Model | Canonical model, collapsed across providers (Qwen via any provider is one line) |
| Project | One project in the organization |
| API key | One API key (by its description) |
For each grouping you get the same two charts:
- Over time — a stacked area chart of the top series across the date range, with Cost / Requests / Tokens tabs.
- Ranking — a horizontal bar chart of the top series for the range, with the same metric tabs and the running totals for the window.
Switch to Project to see which teams or workloads drive the bill, Model for the org-wide model footprint, or API key when usage runs through services rather than people.
How the data is computed
Both charts read from the same pre-aggregated hourly rollups the rest of the dashboard uses — there is no separate analytics pipeline and no scan over raw request logs, so the page stays fast over any range. Aggregation happens per time bucket, so totals line up with the project Analytics and Usage & Metrics pages for the same window.
For a single project's breakdown, see Analytics. For a per-person view of org spend, see Member Analytics.
How is this guide?
Last updated on