Member Analytics
See organization usage and cost broken down per team member
Member Analytics breaks your organization's usage down by person, so you can see who is spending what across every project. It lives on the Members page and is available on the Enterprise plan.
Member analytics require the Enterprise plan and an organization owner or admin role. Non-enterprise organizations see an upgrade card, and members without admin access see an access notice instead of the data.
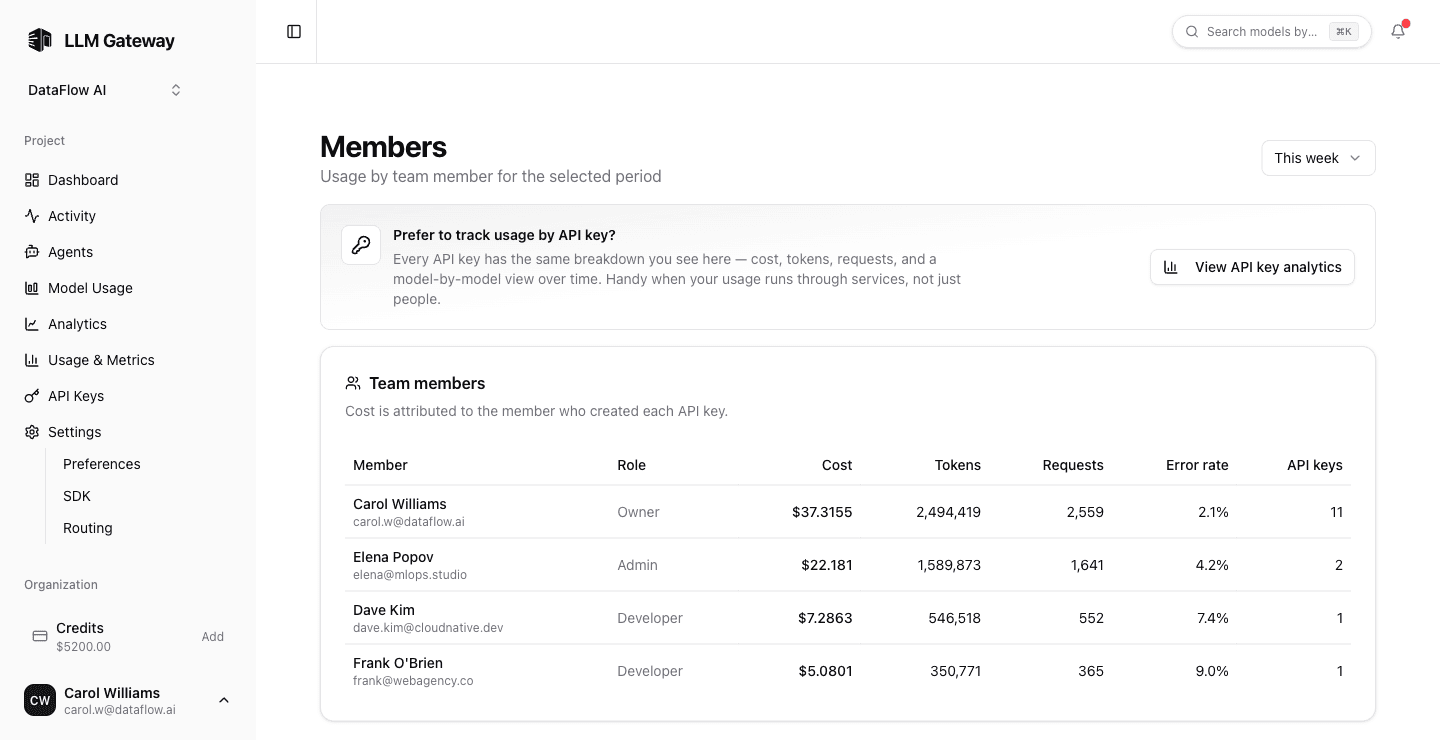
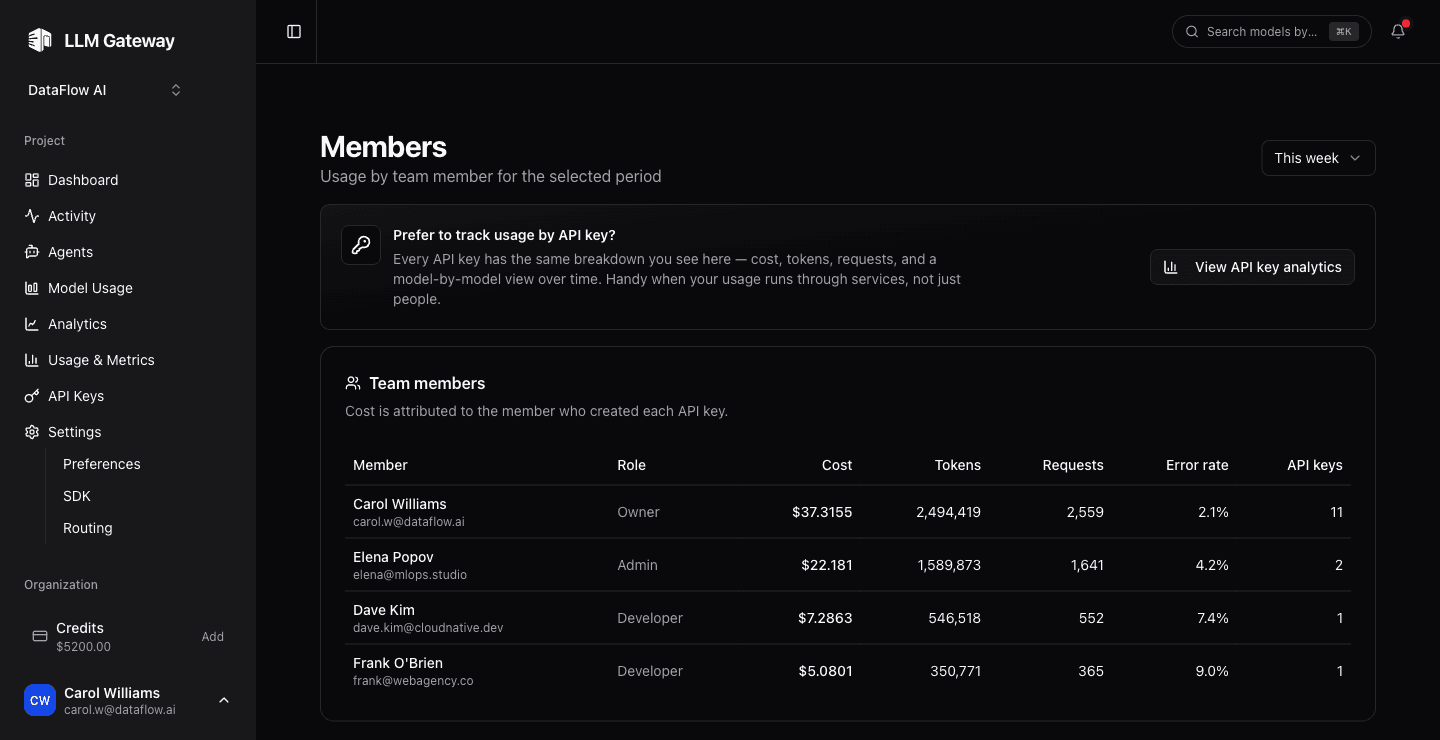
Members Table
The Members page adds a usage table sorted by spend, so the heaviest users surface first. Each row shows that member's totals for the selected date range:
| Column | Description |
|---|---|
| Member | Name and email of the team member |
| Cost | Total spend attributed to the member, in USD |
| Tokens | Total tokens (input + output) |
| Requests | Number of requests |
| Error rate | Share of the member's requests that failed |
| API keys | How many API keys the member created |
Usage is attributed by who created each API key — spend lands on the member who owns the key that made the request, which is the only link between usage and a user.
Member Detail
Click a member to open their detail page, scoped to the same date range:
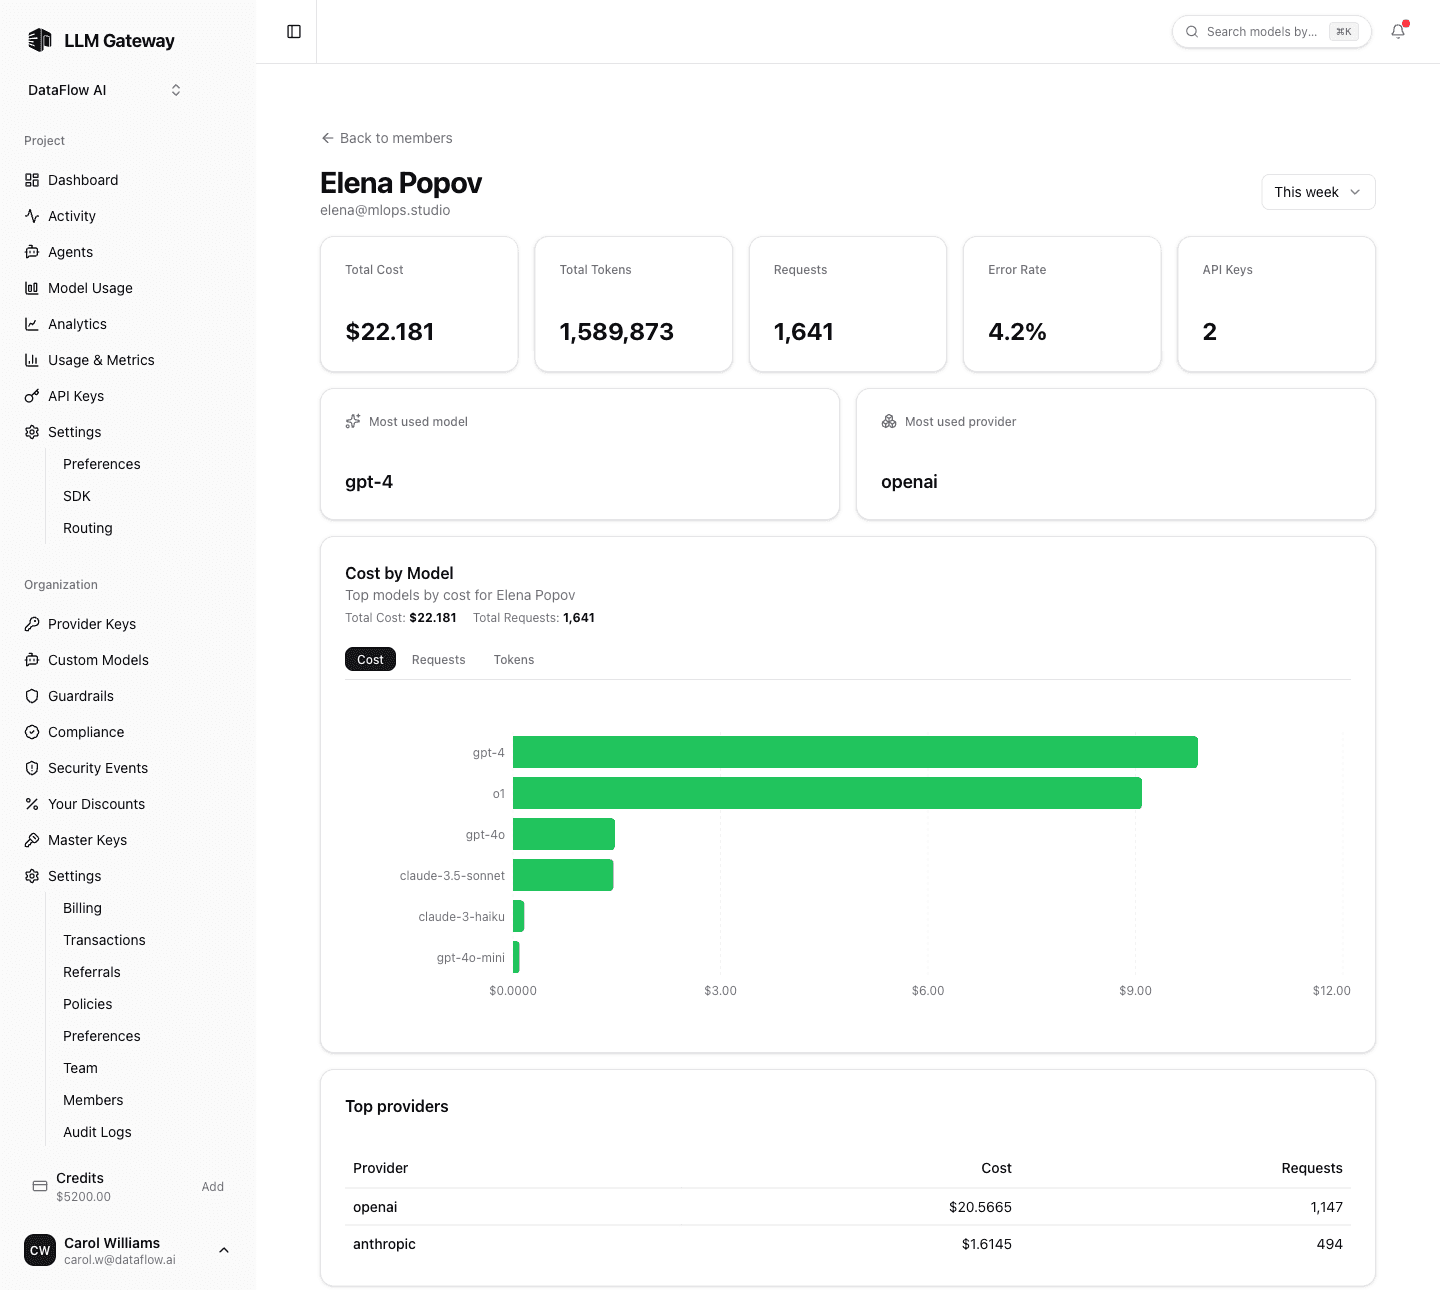
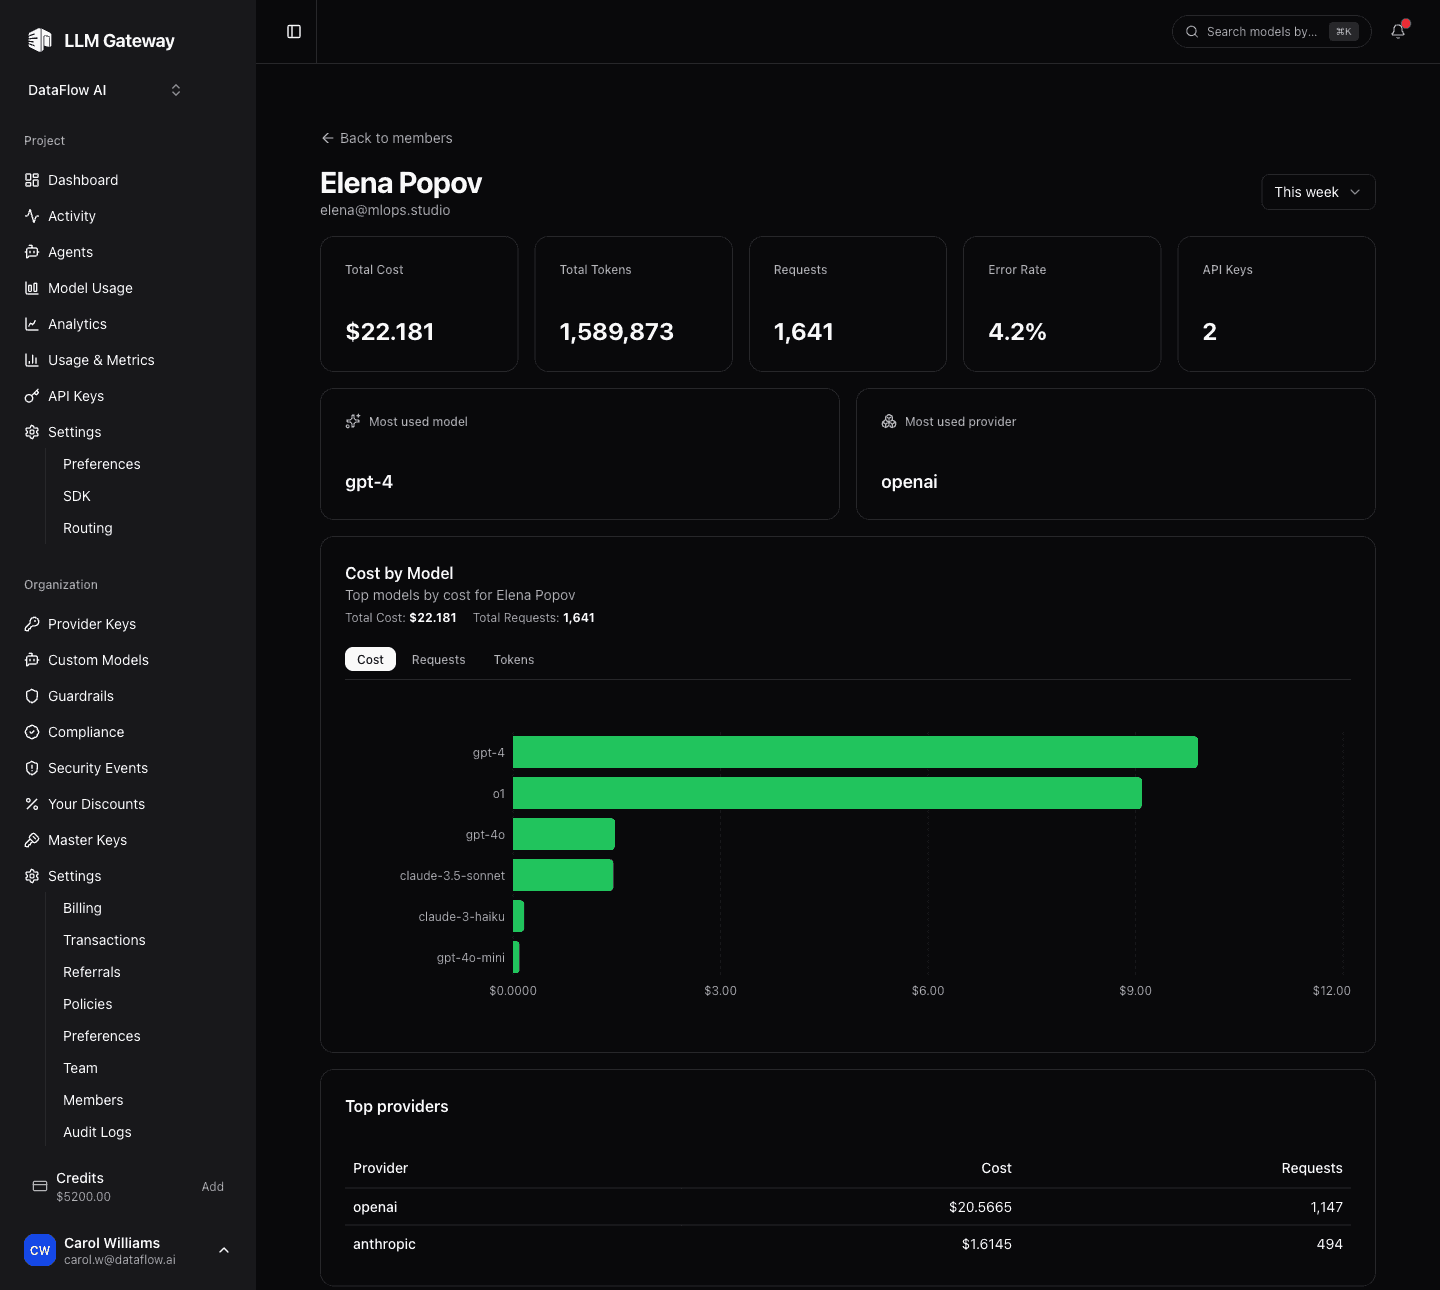
The detail view includes:
- Summary cards — the member's cost, tokens, requests, and error rate for the range.
- Most used — their top model, provider, and app.
- Cost by model — the same breakdown as the project Analytics page, scoped to this member.
- Top providers and top apps — tables ranking where the member's traffic goes.
This makes it easy to attribute cost to a team, investigate a spike, or confirm a member is using the models and providers you expect.
How is this guide?
Last updated on