Knowledge base
Model Usage
Track usage breakdown by individual model
The Model Usage page shows how your API requests are distributed across different LLM models over time.
Filters
Two filters let you narrow down the data:
- API Key — Select a specific API key or view usage across all keys
- Date range — Choose a time period to analyze
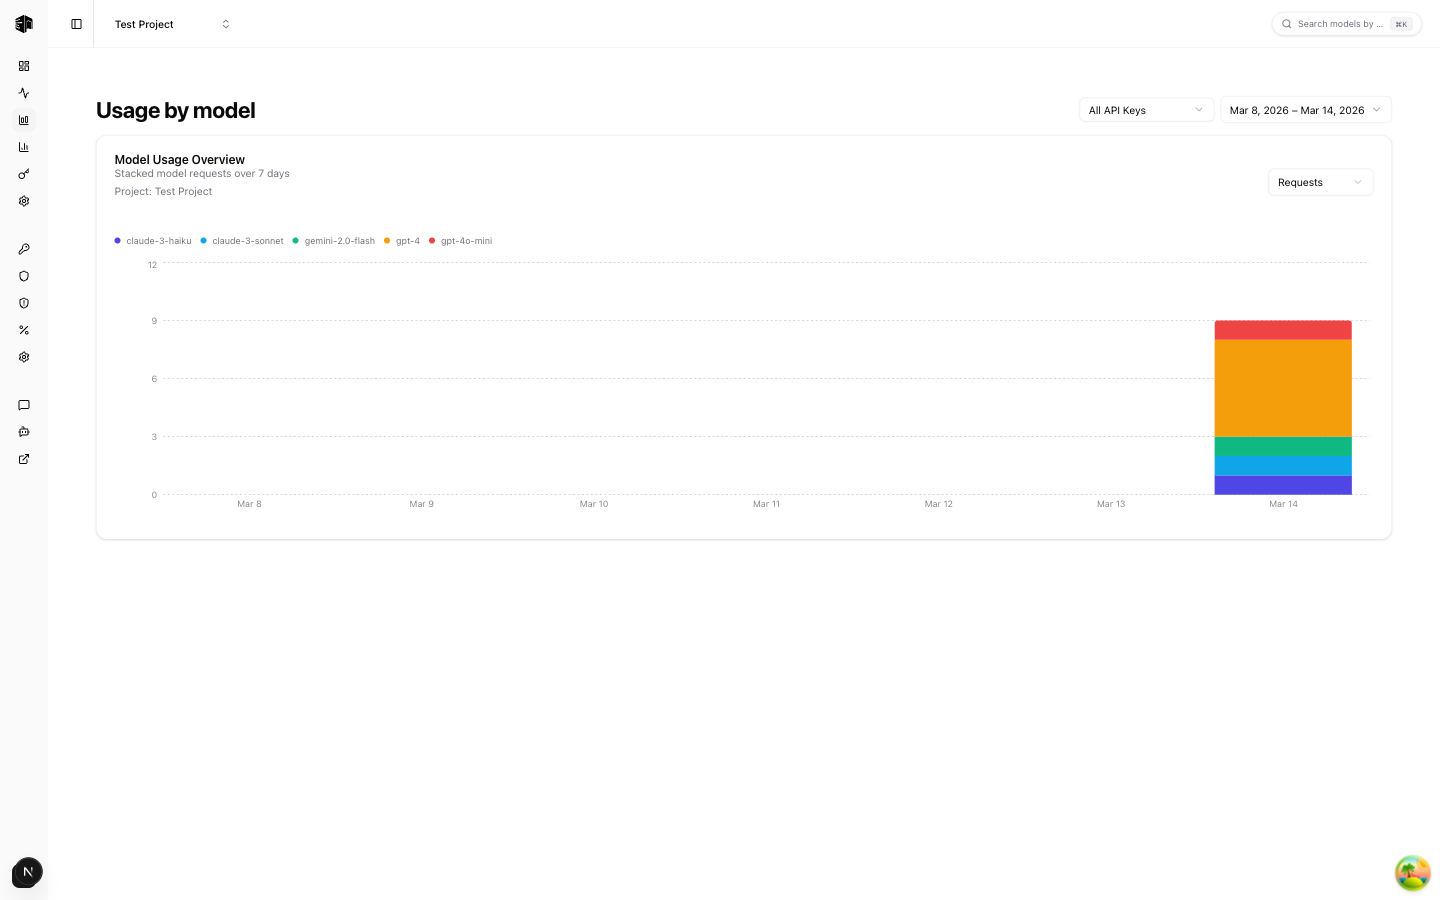
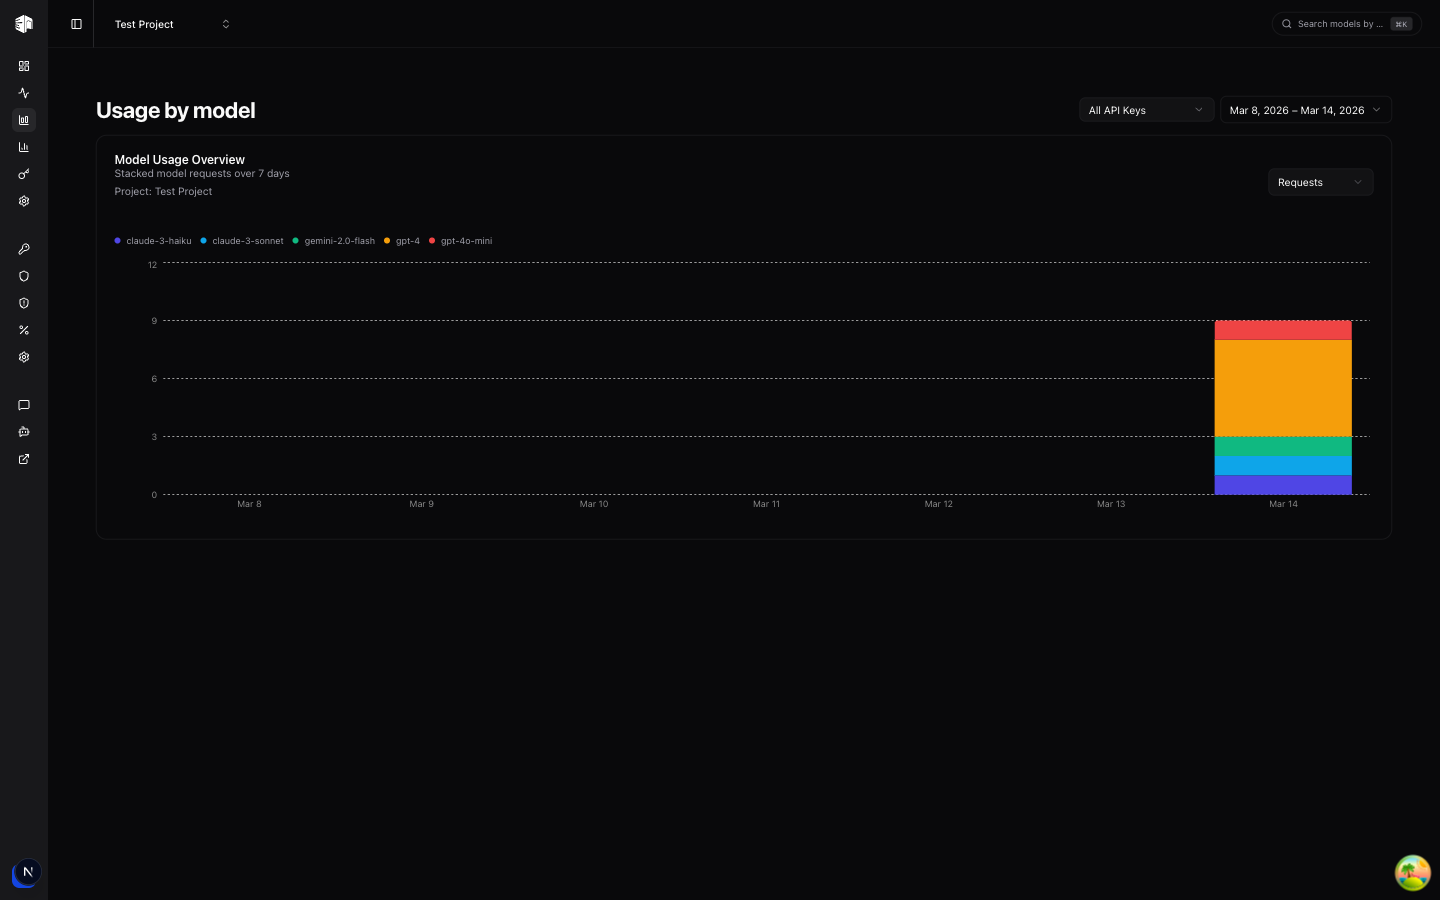
Usage Chart
The main chart displays a time-series breakdown of requests per model. Each model is represented by a different color, making it easy to see:
- Which models are used most frequently
- How usage patterns change over time
- Whether usage is concentrated on a single model or spread across many
This page is useful for understanding your model distribution and identifying opportunities to optimize costs by switching to more cost-effective models for certain workloads.
How is this guide?
Last updated on