Knowledge base
Usage & Metrics
Detailed analytics for requests, models, errors, caching, and costs
The Usage & Metrics page provides comprehensive analytics through five tabs, giving you deep insight into your LLM API usage patterns.
Filters
- API Key — Filter metrics by a specific API key or view all
- Date range — Select the time period (defaults to last 7 days)
Tabs
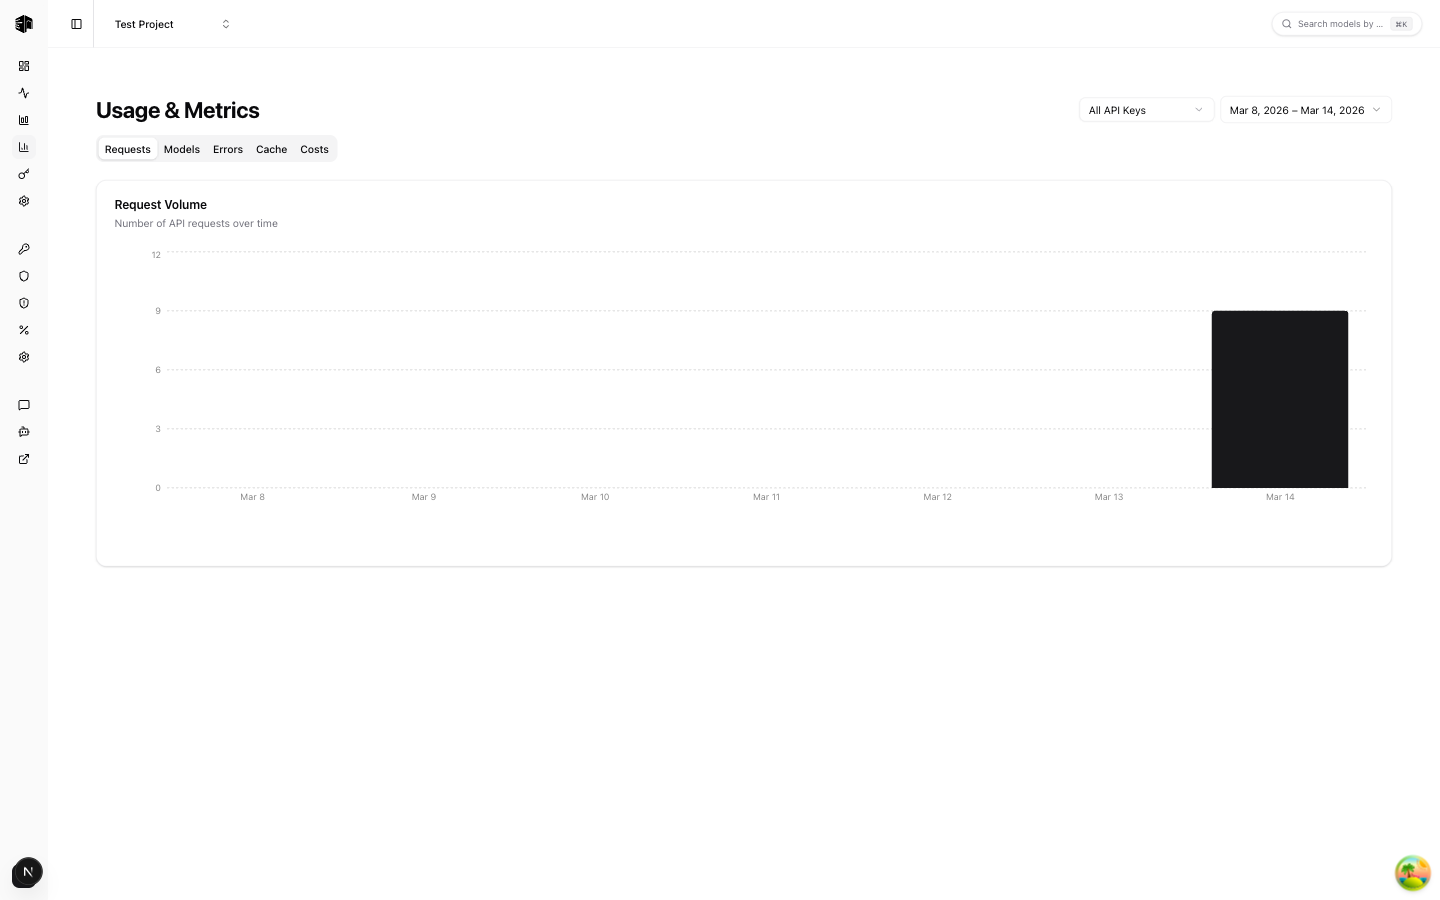
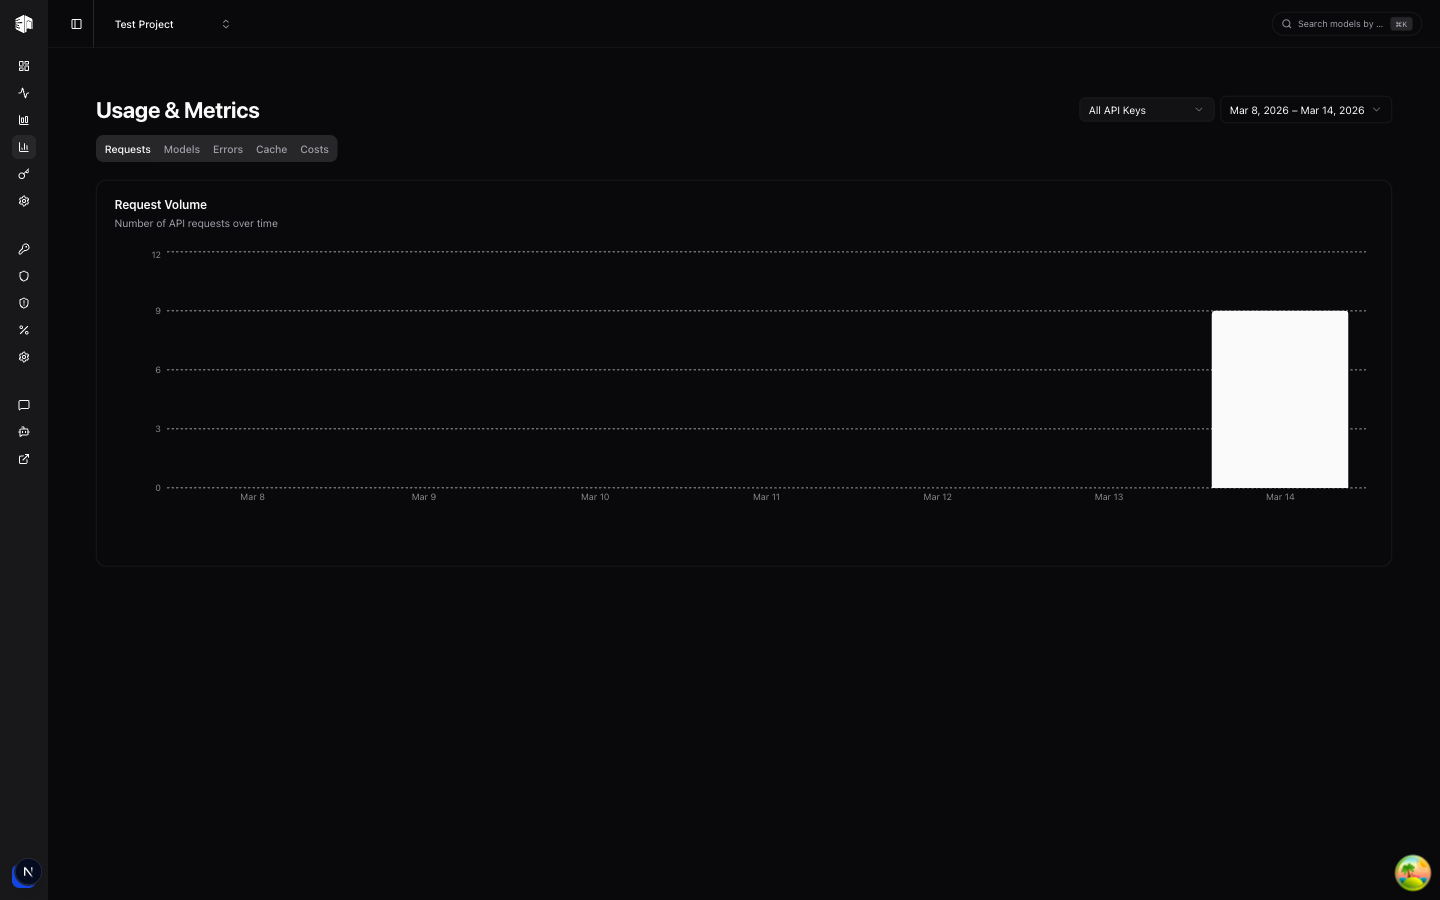
Requests
A time-series chart showing request volume over the selected period. Use this to identify traffic patterns, peak usage times, and growth trends.
Models
A table showing your top-used models ranked by request count. For each model you can see:
- Total requests
- Token consumption
- Associated costs
This helps you understand which models drive the most usage and cost.
Errors
A chart showing error rates over time. Track:
- Error frequency and trends
- Spikes that may indicate provider issues
- Overall reliability of your API calls
Cache
A chart showing your cache hit rate over time. Monitor:
- How effectively caching is reducing redundant requests
- Cache hit vs. miss ratios
- The cost savings from cached responses
Costs
A cost breakdown chart showing spending patterns. Analyze:
- Cost trends over time
- Cost distribution by provider or model
- Opportunities to reduce spending
How is this guide?
Last updated on