Dashboard
Your central hub for monitoring LLM usage, costs, and performance
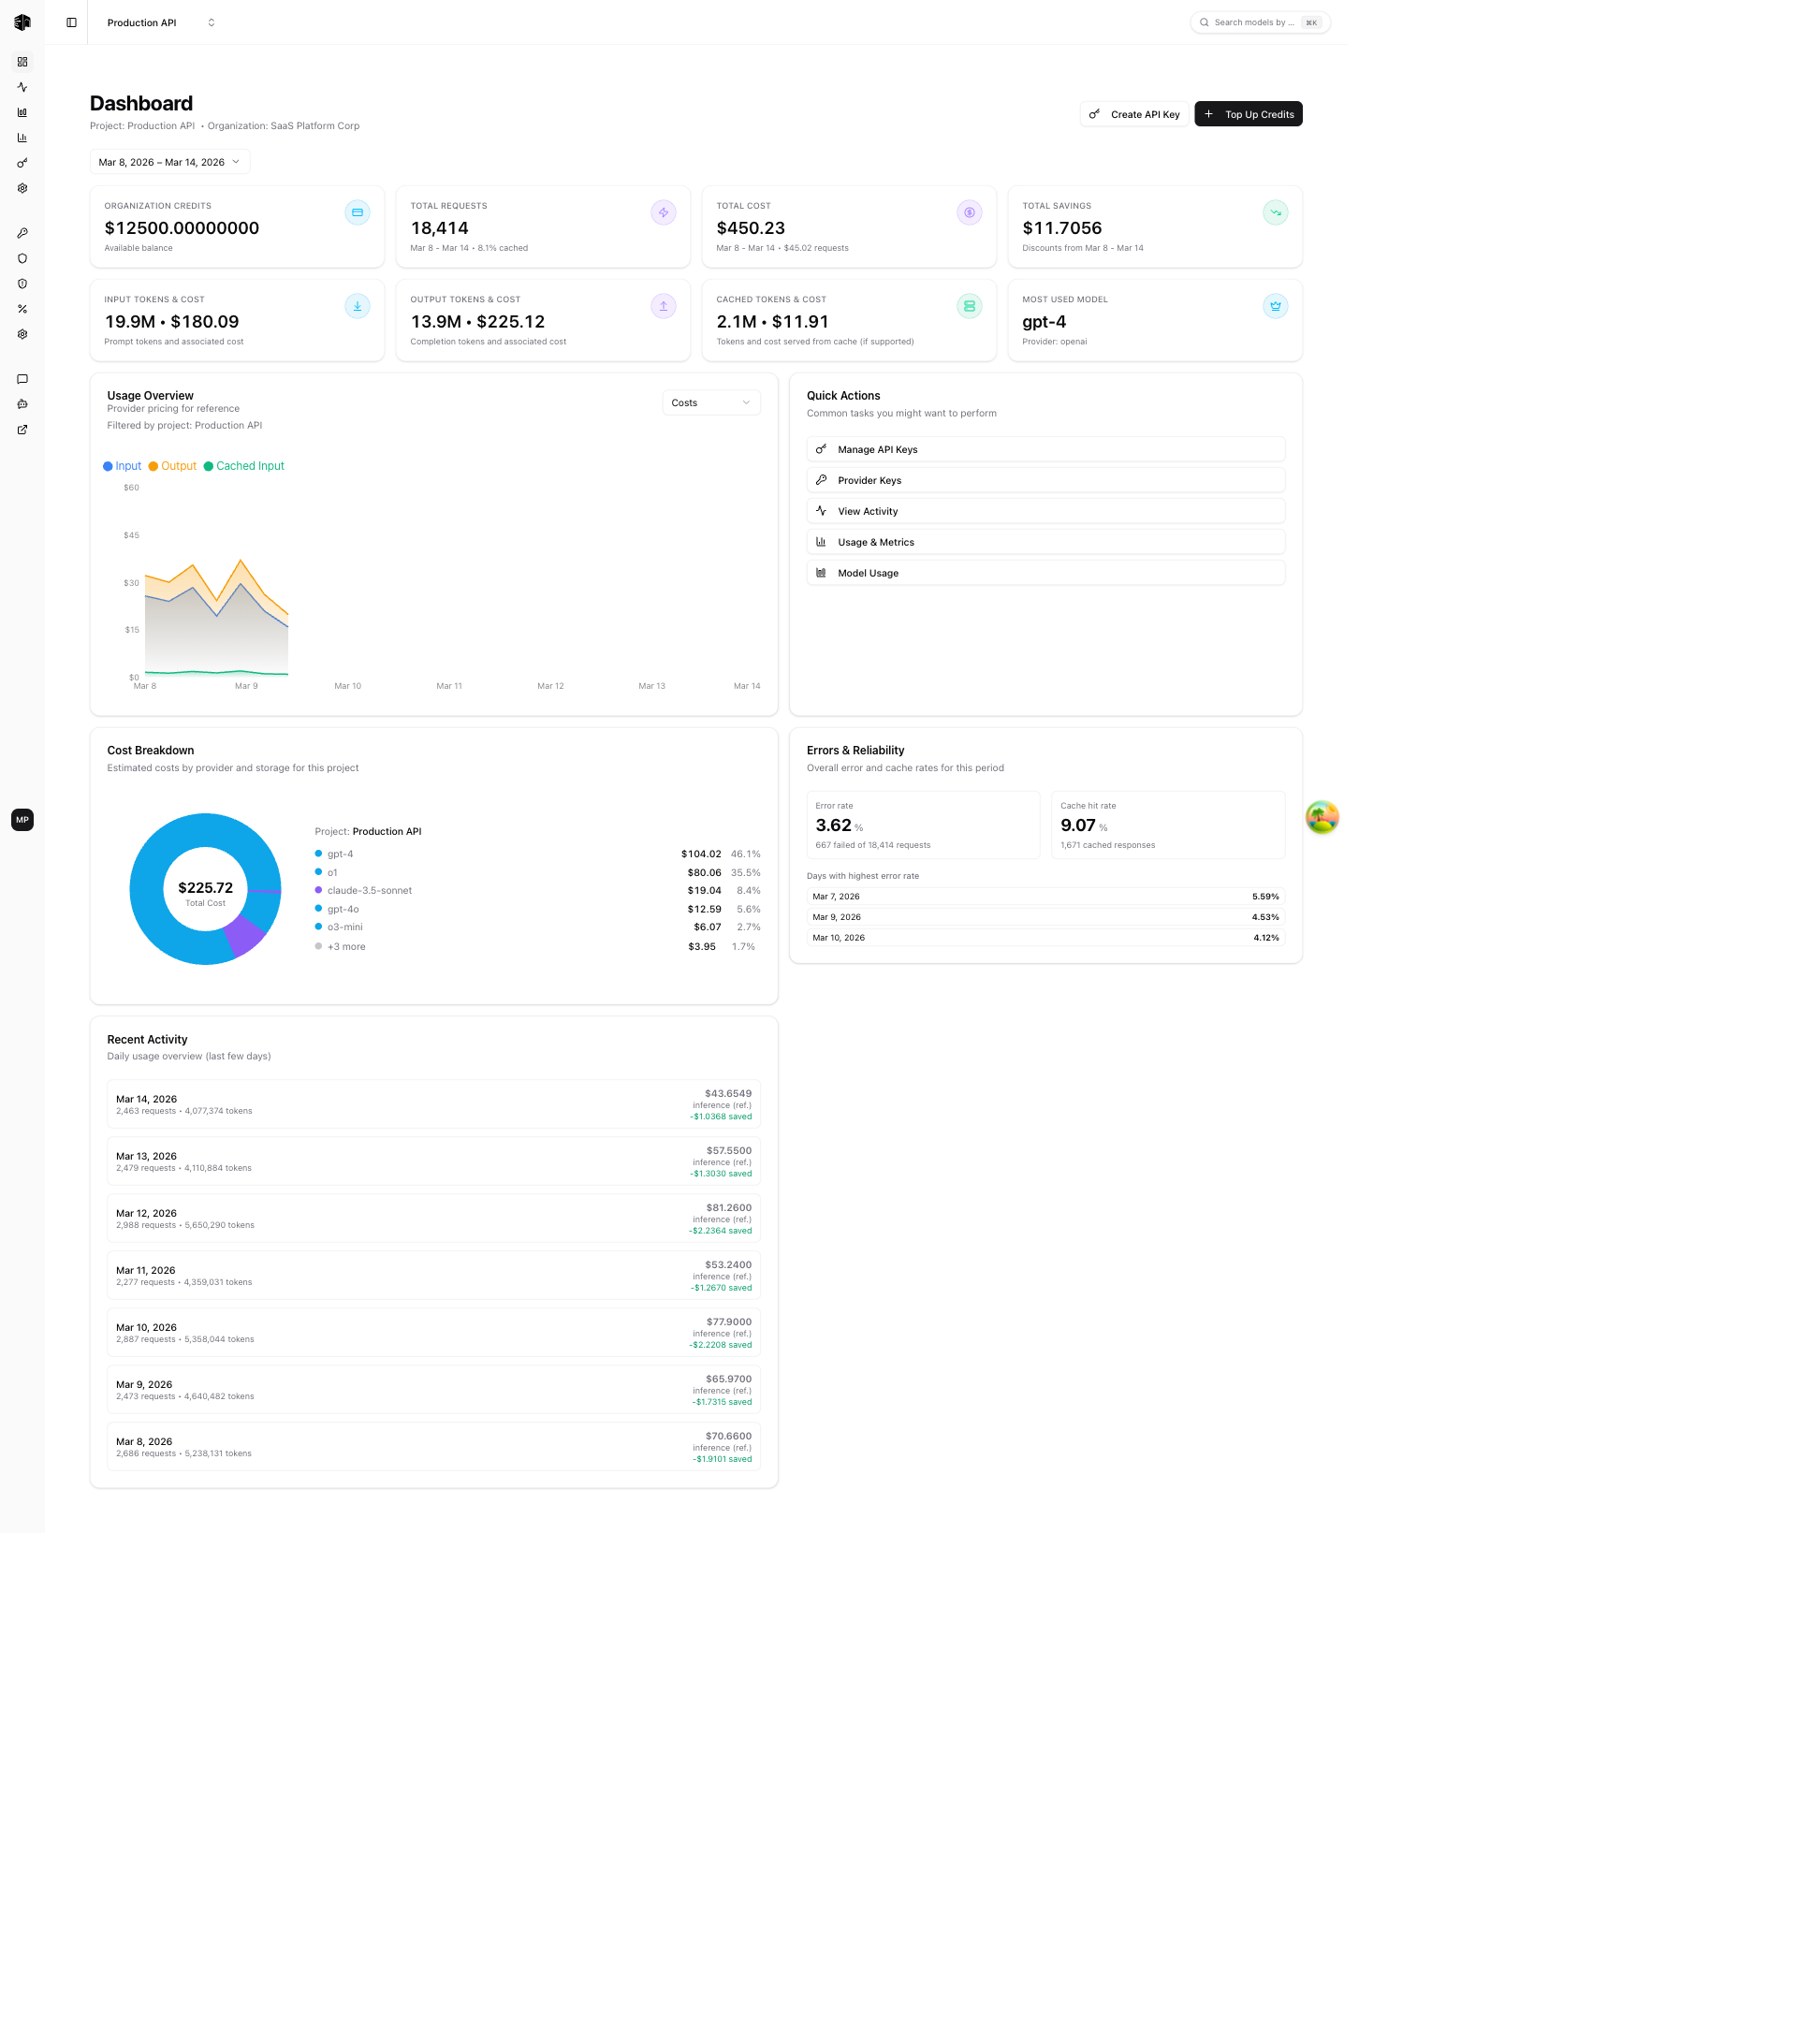
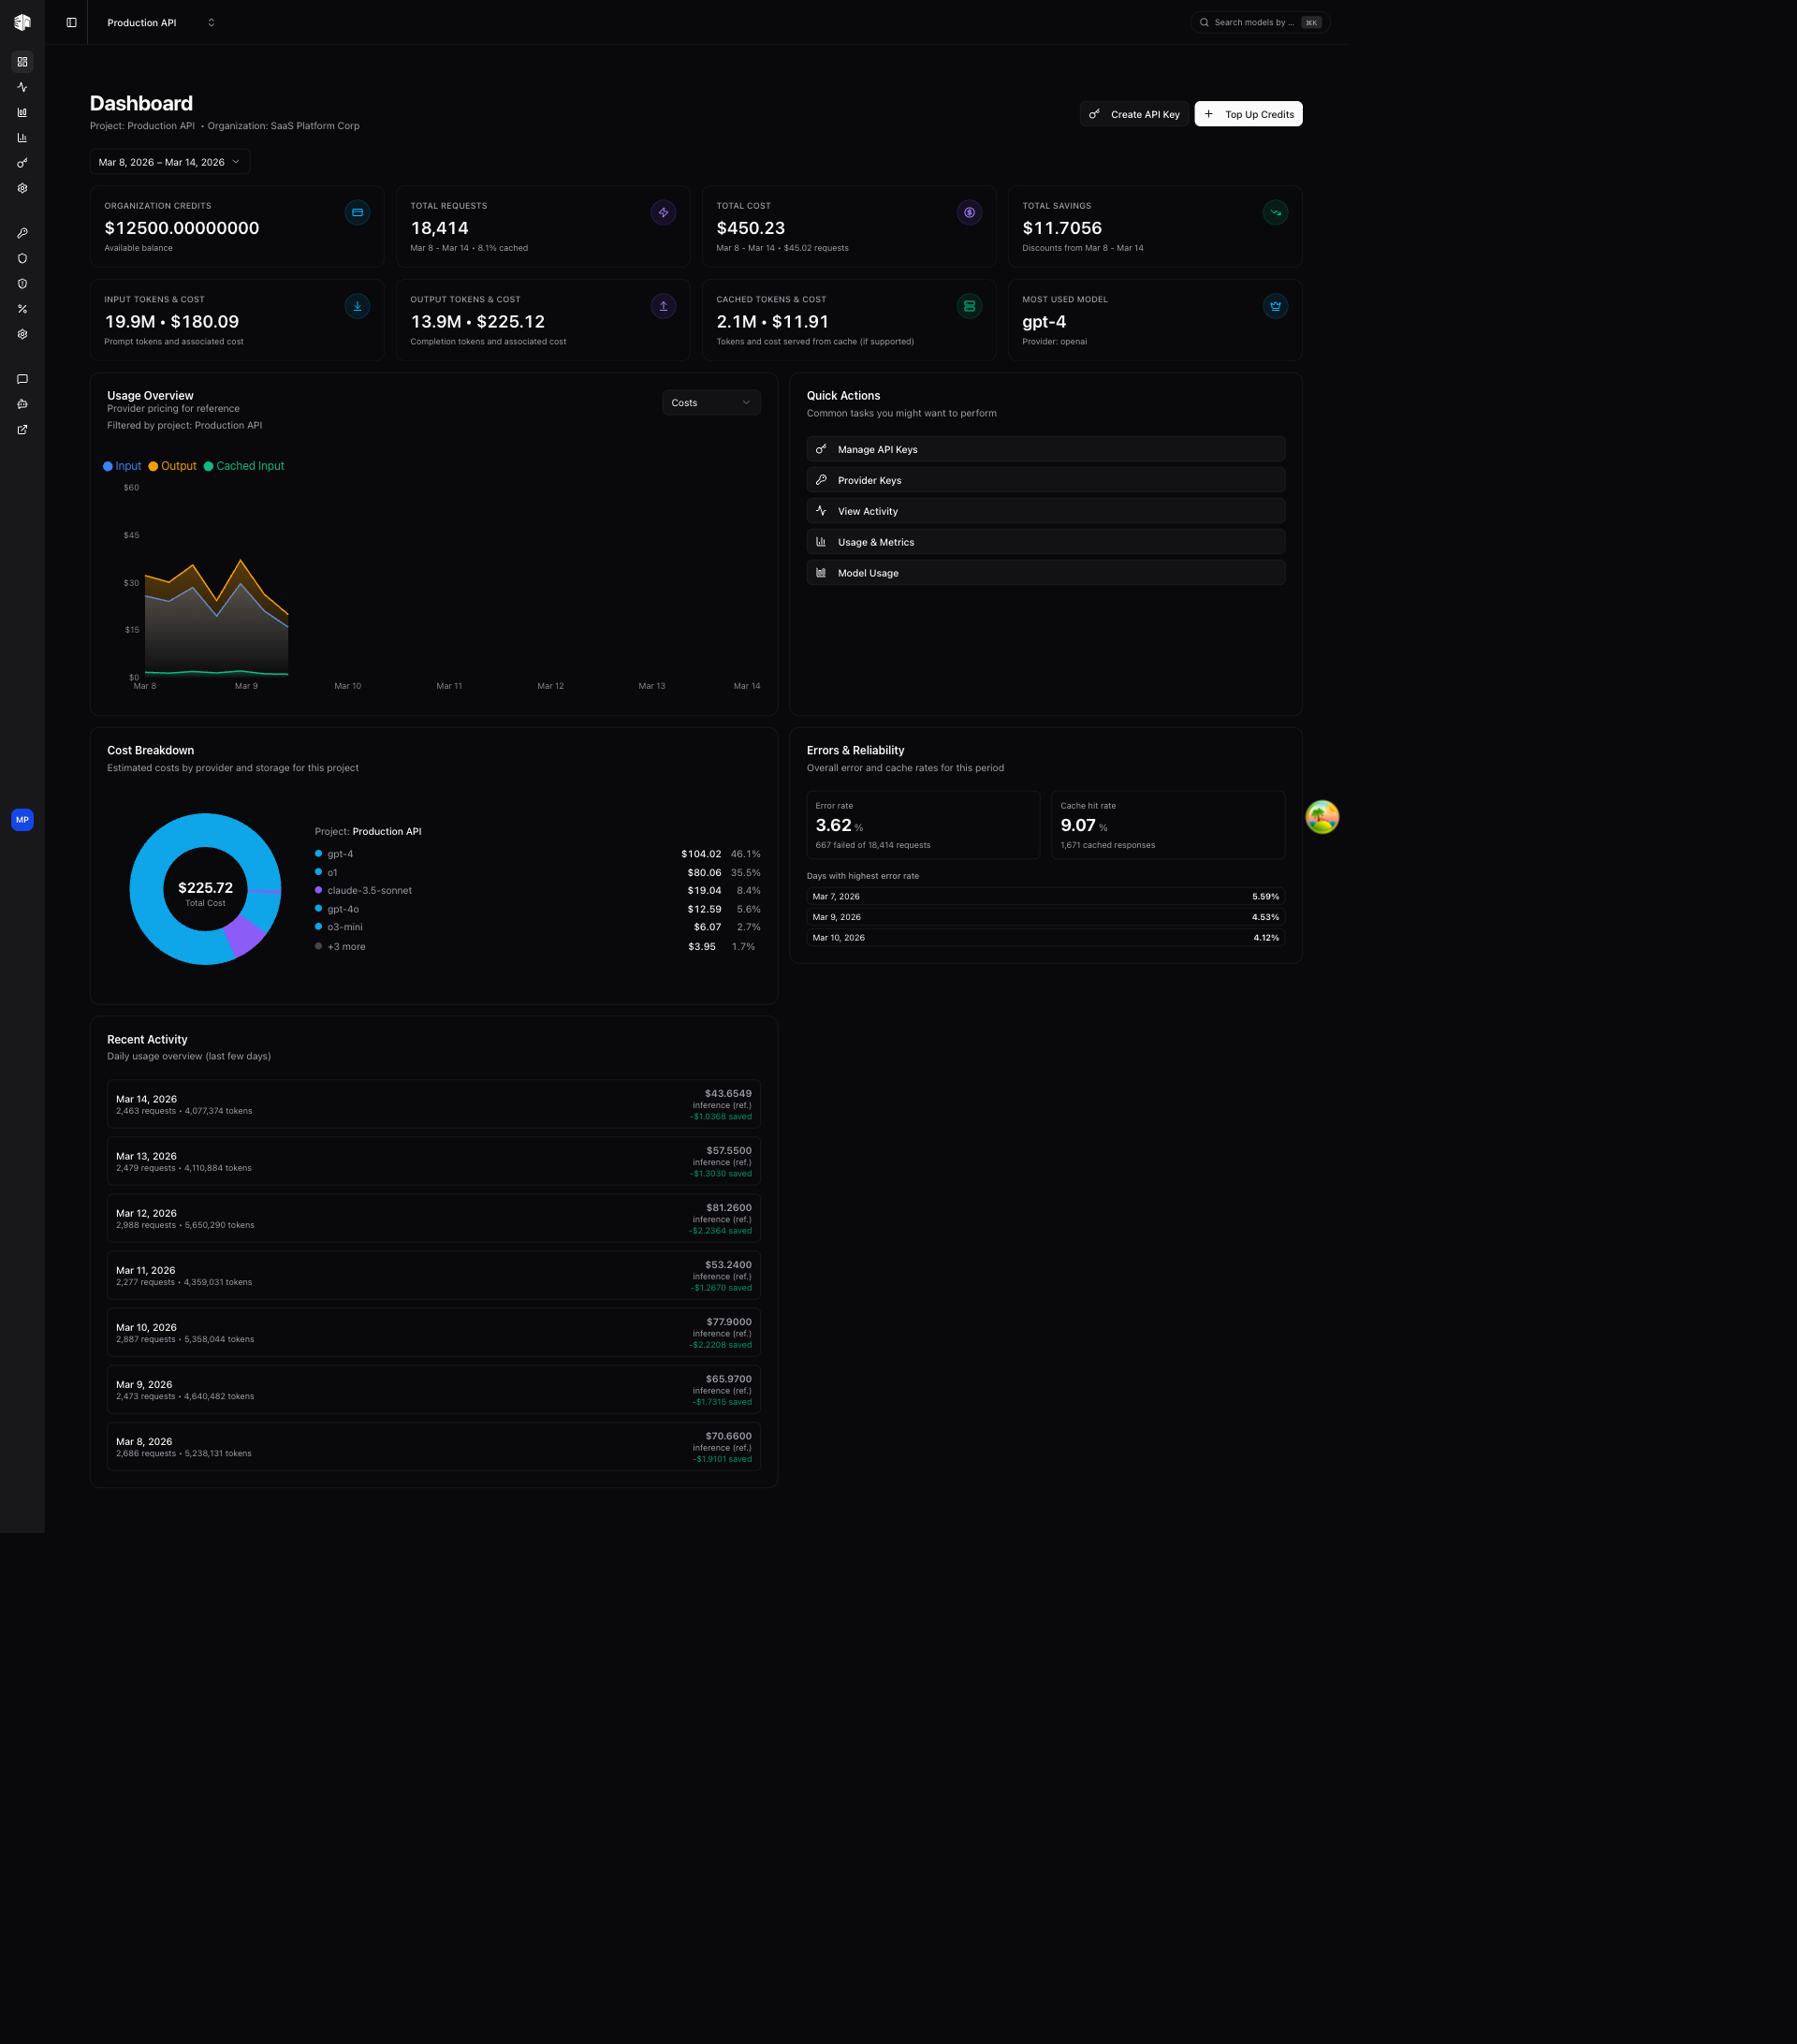
The Dashboard is the first page you see after logging in. It provides a high-level overview of your project's LLM usage, costs, and performance at a glance.
Date Range
At the top of the page, you can toggle the date range for all dashboard metrics:
- 7 days — Last 7 days of data (default)
- 30 days — Last 30 days of data
- Custom — Pick a custom start and end date
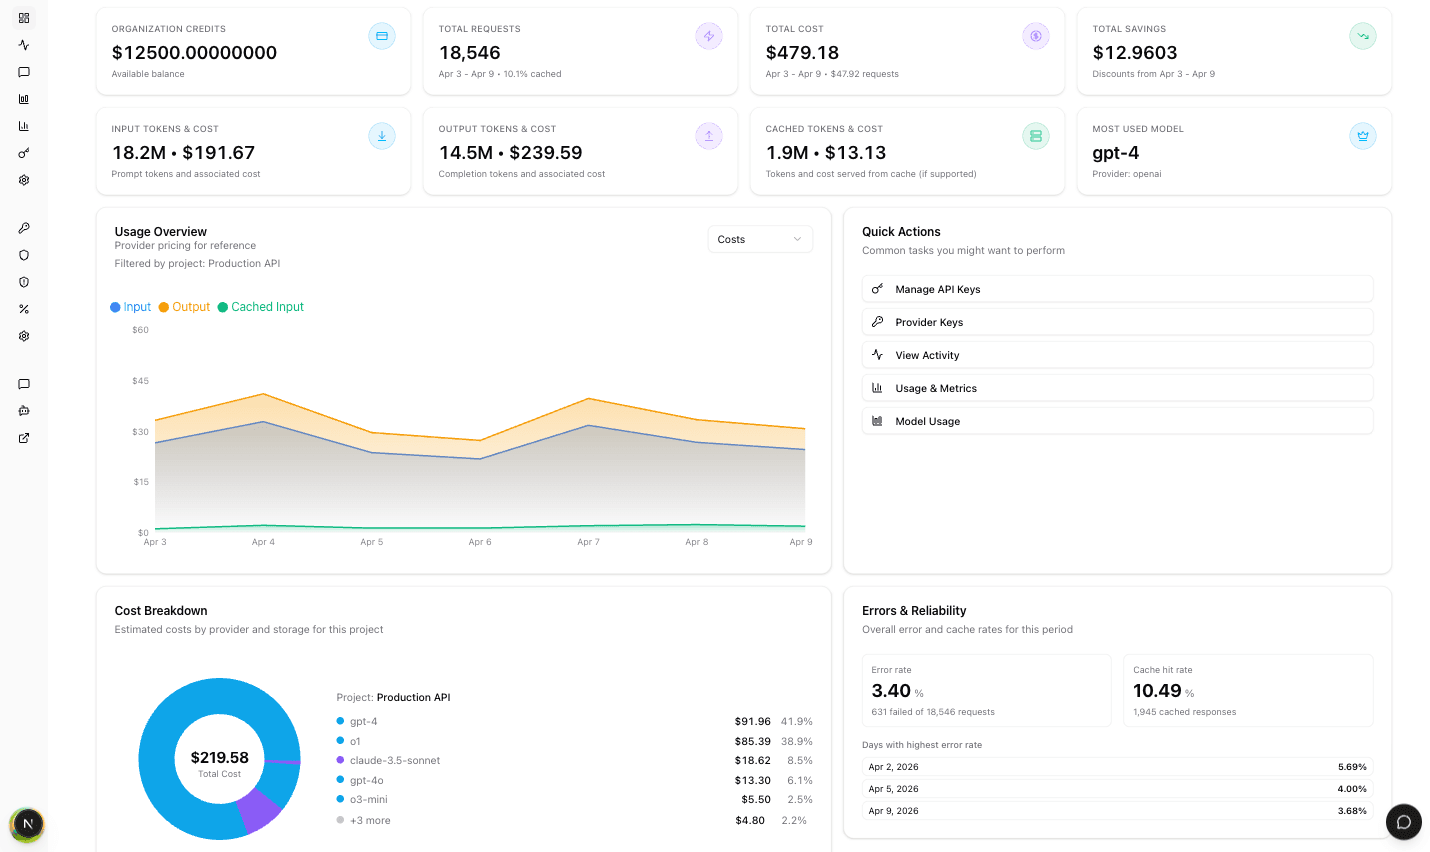
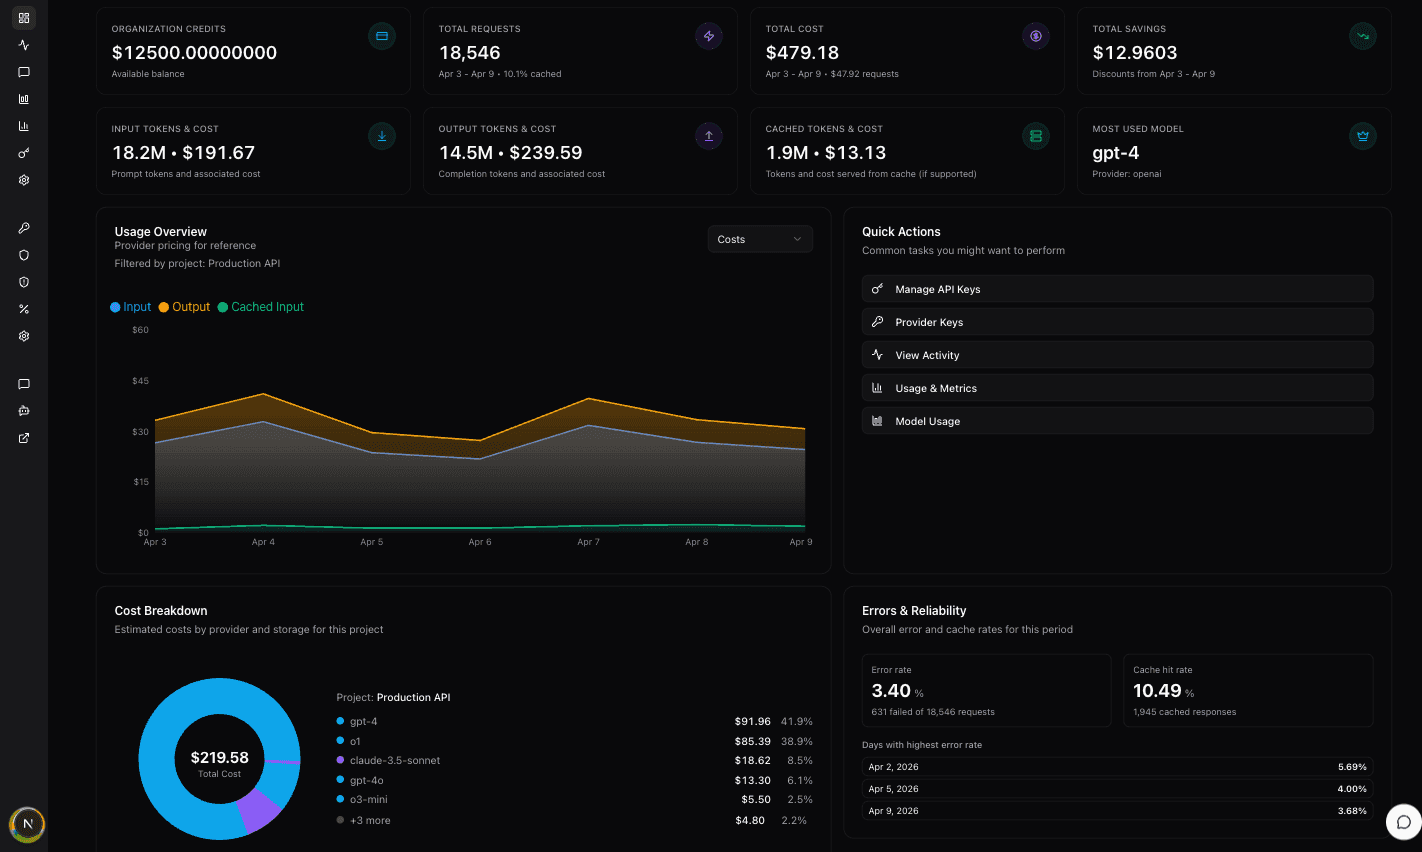
Stat Cards
The dashboard displays eight metric cards in two rows:
Top Row
| Card | Description |
|---|---|
| Organization Credits | Your current available credit balance |
| Total Requests | Number of API requests in the selected period, with cache hit percentage |
| Total Cost | Total inference cost for the period, including storage costs |
| Total Savings | Savings from discounts during the selected period |
Bottom Row
| Card | Description |
|---|---|
| Input Tokens & Cost | Total prompt tokens sent and their associated cost |
| Output Tokens & Cost | Total completion tokens received and their associated cost |
| Cached Tokens & Cost | Tokens served from cache (if caching is enabled) and the cost saved |
| Most Used Model | The model with the highest request count, along with its provider |
Usage Overview Chart
Below the stat cards, a chart visualizes your usage over time. You can toggle between two views using the dropdown:
- Costs — Shows input, output, and cached input costs as a stacked area chart
- Requests — Shows request volume over time
The chart is filtered by the currently selected project.
Quick Actions
A sidebar panel provides shortcuts to common tasks:
- Manage API Keys — Go to the API Keys page
- Provider Keys — Configure your own provider keys
- View Activity — See detailed request logs
- Usage & Metrics — Dive into usage analytics
- Model Usage — View per-model usage breakdown
Cost Breakdown
A donut chart showing how your costs are distributed across different models and providers. Each segment is color-coded and labeled with the model name and cost, making it easy to identify your biggest cost drivers.
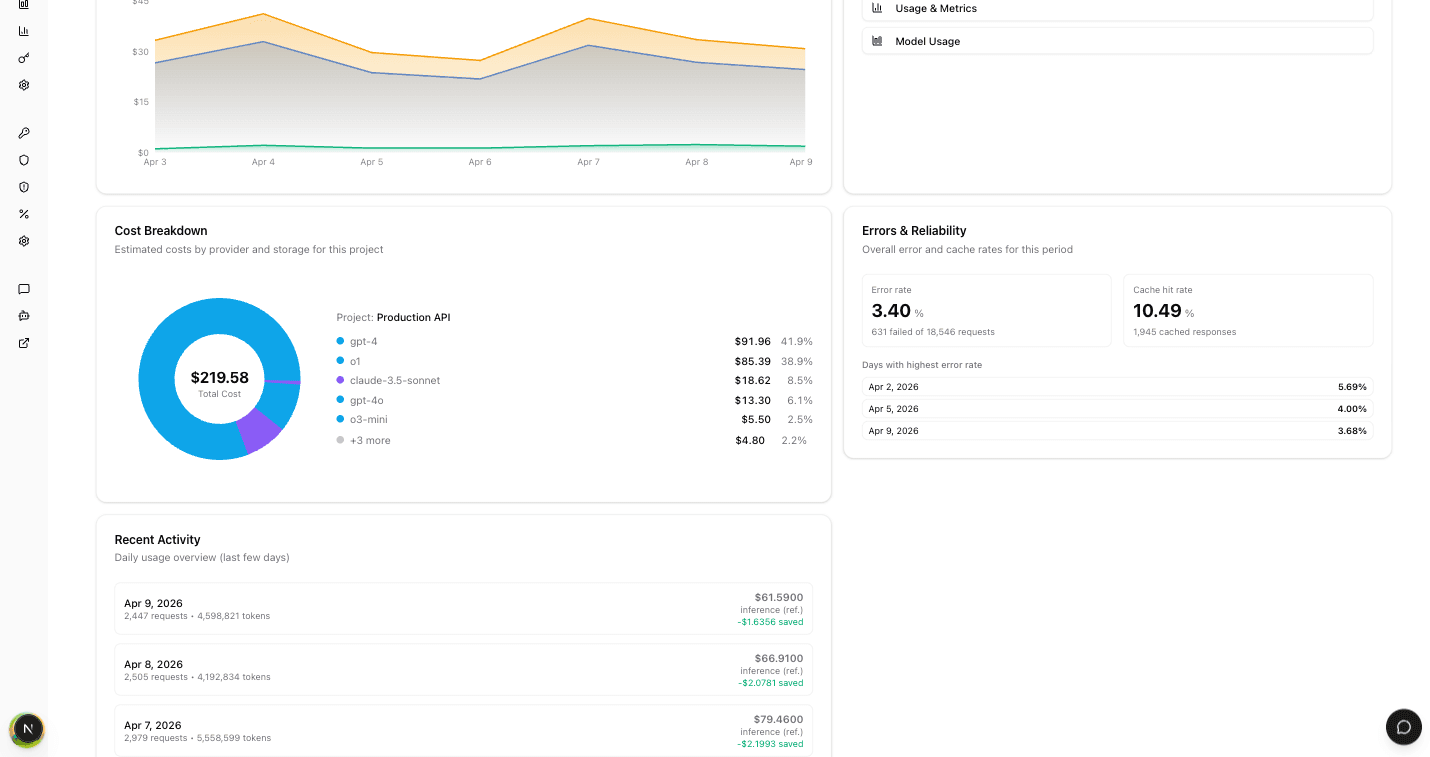
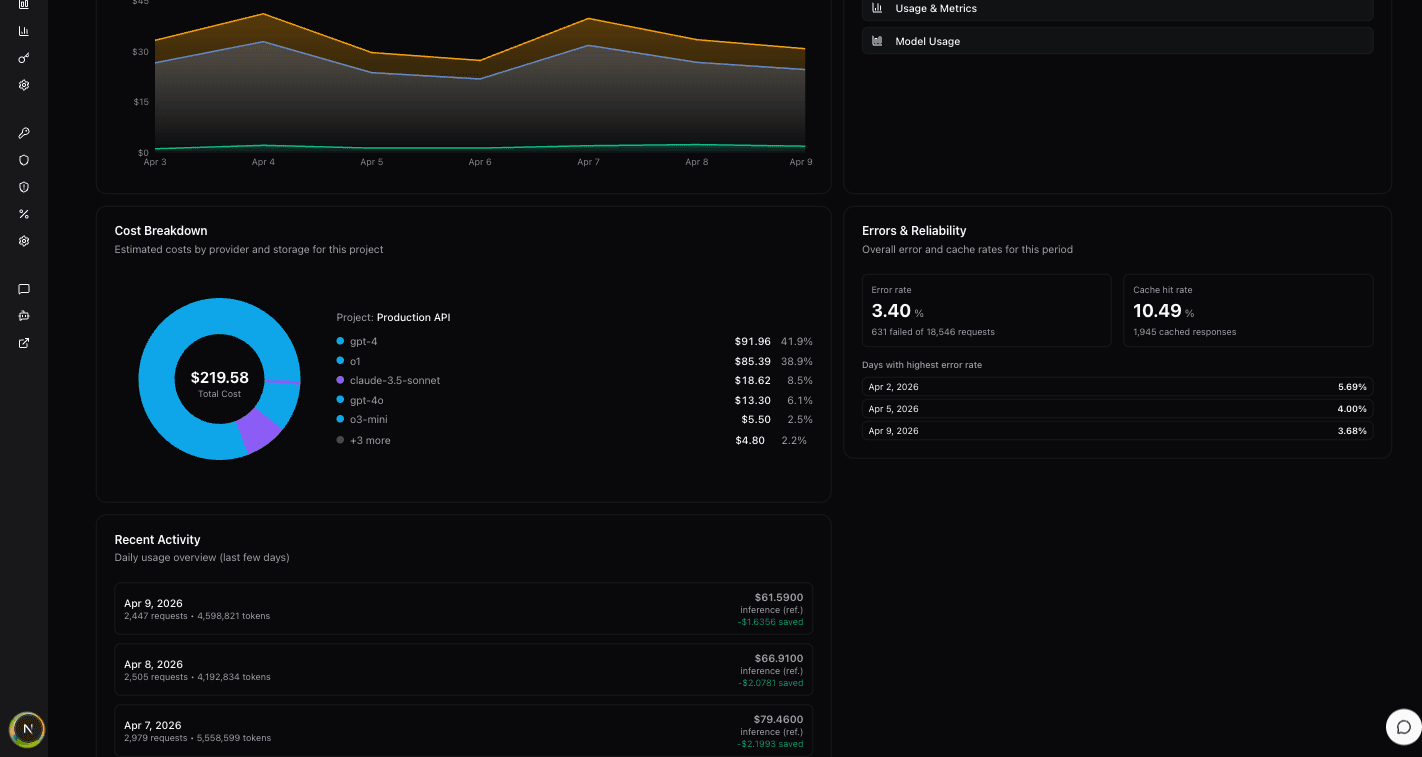
Errors & Reliability
Displays two key reliability metrics:
- Error Rate — Percentage of failed requests over the selected period
- Uptime — Gateway availability percentage
Recent Activity
A table showing your most recent API requests with key details like model, status, tokens, duration, and cost. Click any entry to view the full request detail.
Header Actions
Two buttons in the top-right corner:
- Create API Key — Quickly create a new API key for your project
- Top Up Credits — Add credits to your organization balance
How is this guide?
Last updated on