Knowledge base
Wrapped
Your organization's year on LLM Gateway, as a shareable summary
The Wrapped page sums up a calendar year of your organization's usage and turns it into a card you can share.
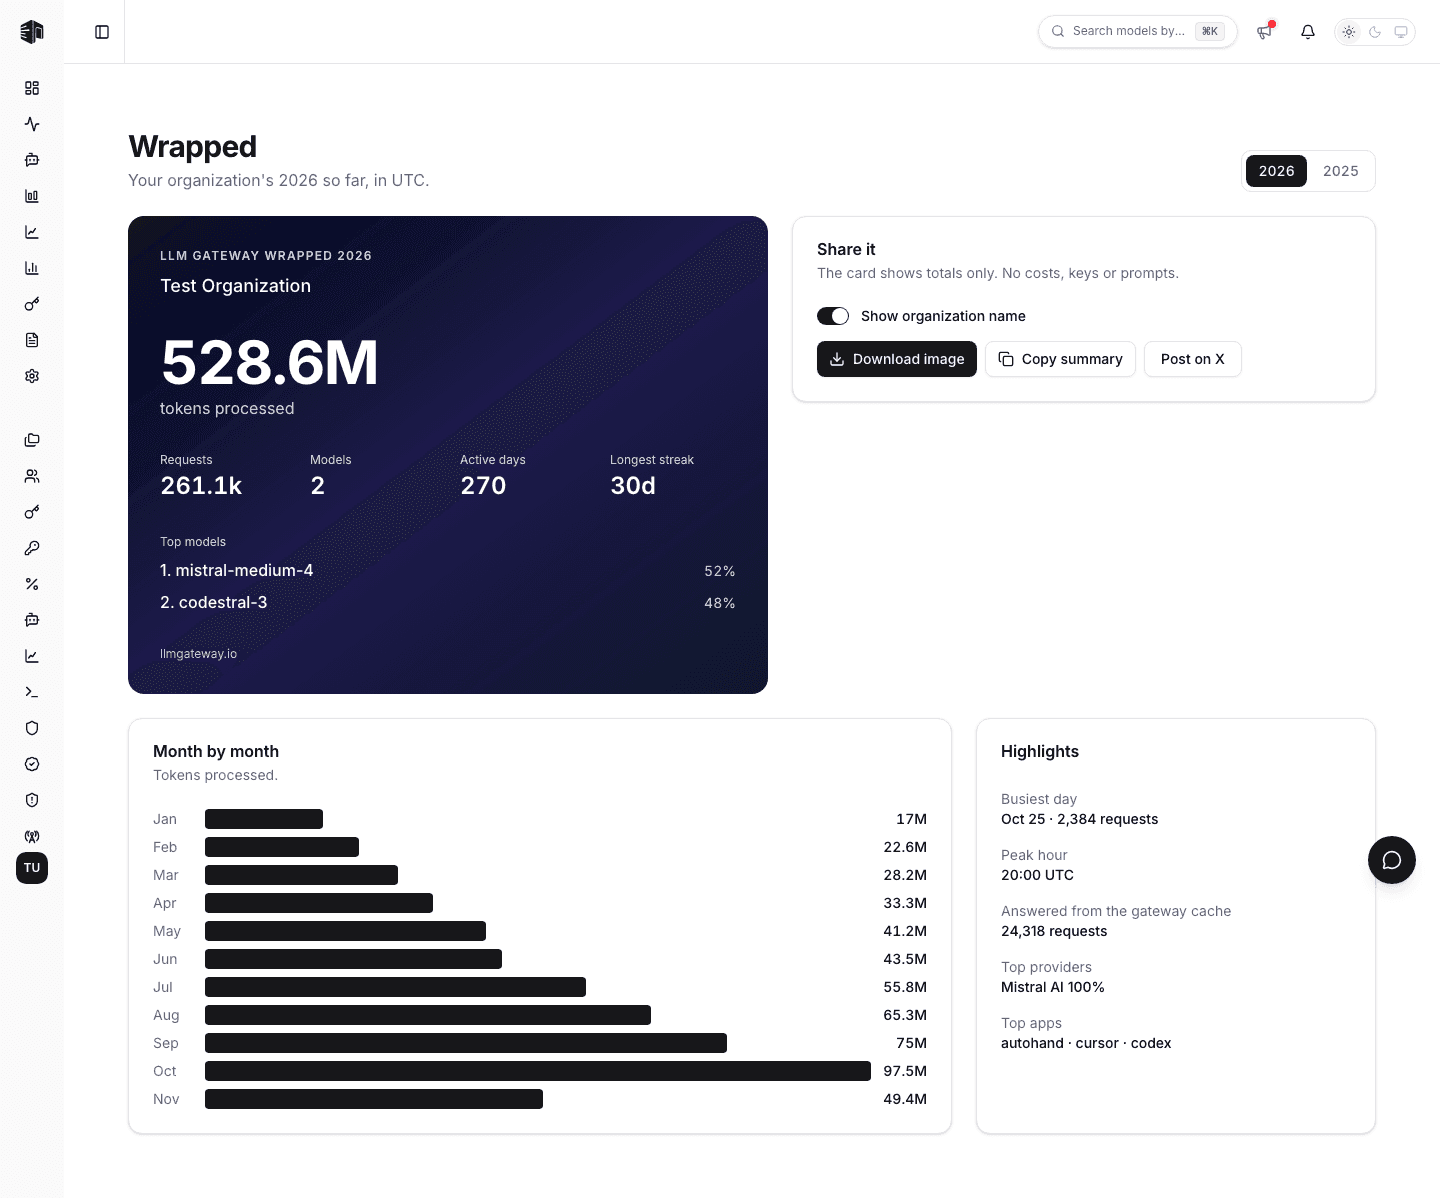
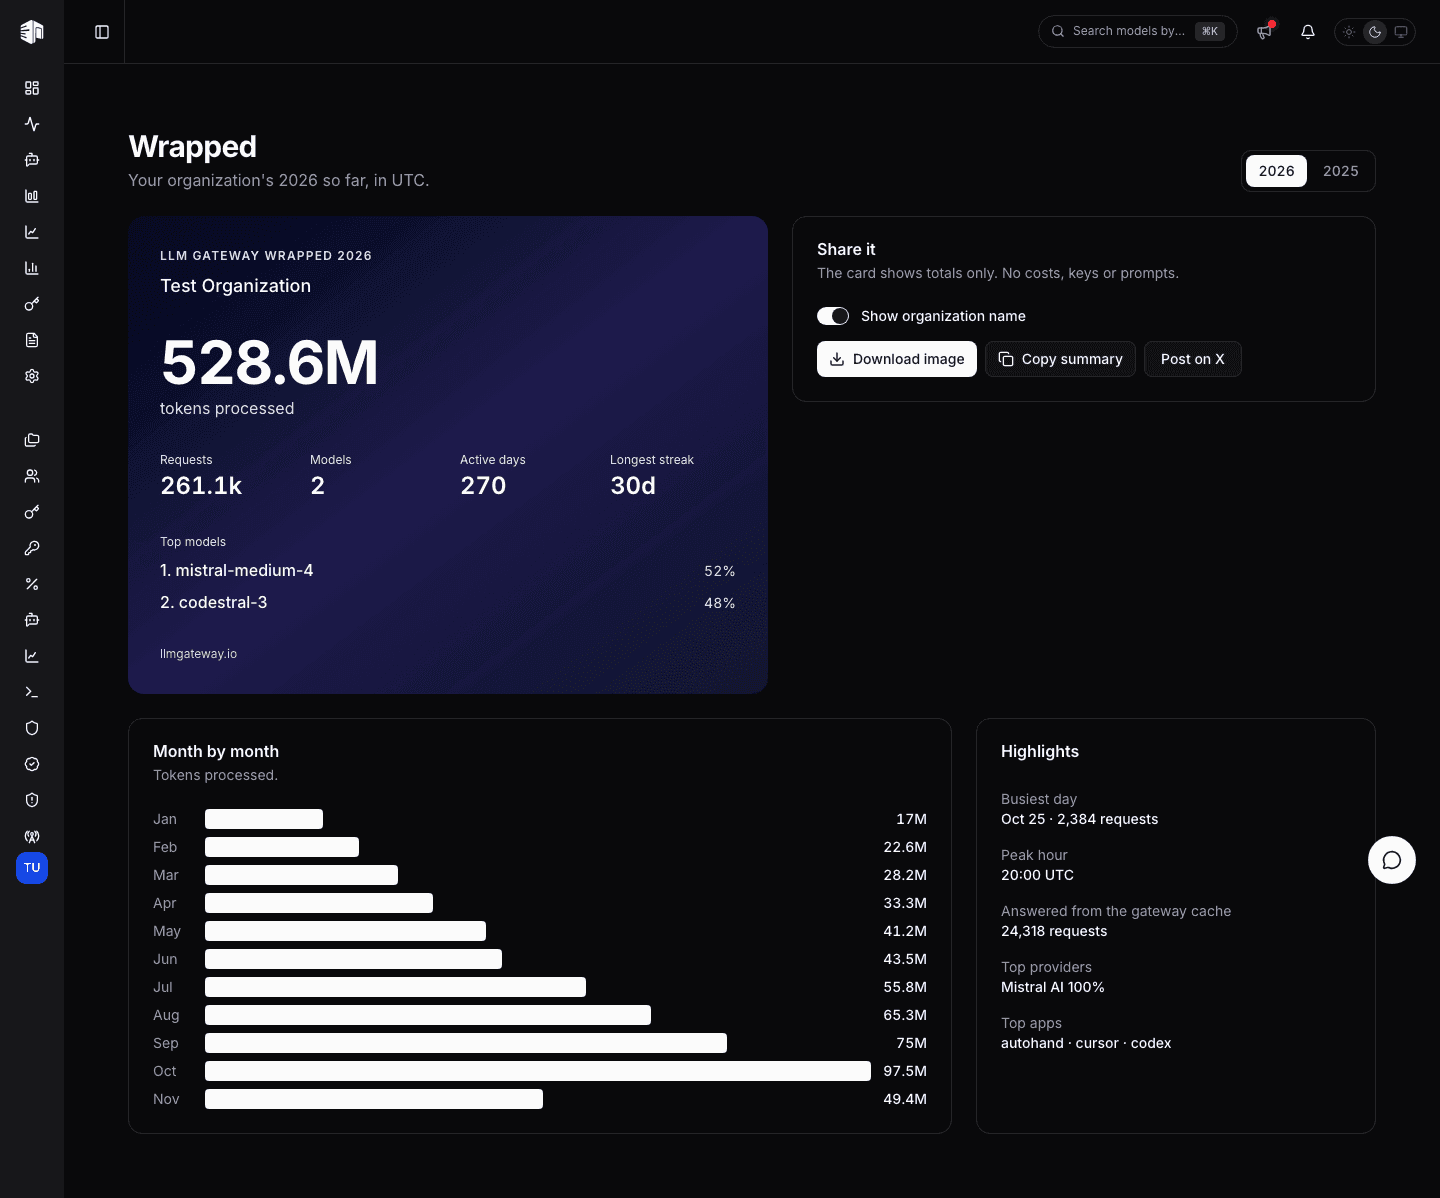
Find it in the sidebar under Settings → Wrapped. Use the year switch at the top right to look at a previous year. The current year updates as you send requests.
Wrapped covers every project in the organization, so only owners and admins can open it.
What it shows
All figures are for the selected year, in UTC.
| Field | Description |
|---|---|
| Tokens processed | Input and output tokens across all projects |
| Requests | Requests sent through the gateway |
| Models | Distinct models used, whichever provider served them |
| Active days | Days with at least one request |
| Longest streak | Most consecutive active days |
| Top models | The three most used models with their share of tokens |
| Month by month | Tokens processed in each month |
| Busiest day | The day with the most requests |
| Peak hour | The hour of the day with the most requests |
| Answered from the gateway cache | Requests served by gateway caching |
| Prompt-cached input | Input tokens billed at a provider's cached rate |
| Top providers | The providers that served the most tokens |
| Top apps | The sources that sent the most requests |
Deleted projects are not counted.
Sharing
The card holds totals only: no costs, API keys or prompts.
- Show organization name — turn it off to share the numbers without the name.
- Download image — saves the card as a PNG.
- Copy summary — copies a short text version.
- Post on X — opens a post with the summary filled in.
How is this guide?
Last updated on